
Digital & Data
Making circular value chains visible, measurable and coordinated.
A value chain nobody can see cannot be financed. RETEDI designs the digital layer — resource maps, residue passports, logistics models and decision dashboards — that turns a dispersed regional resource into a coordinated, investable system.
Decision-support
One console. Every question a project must answer.
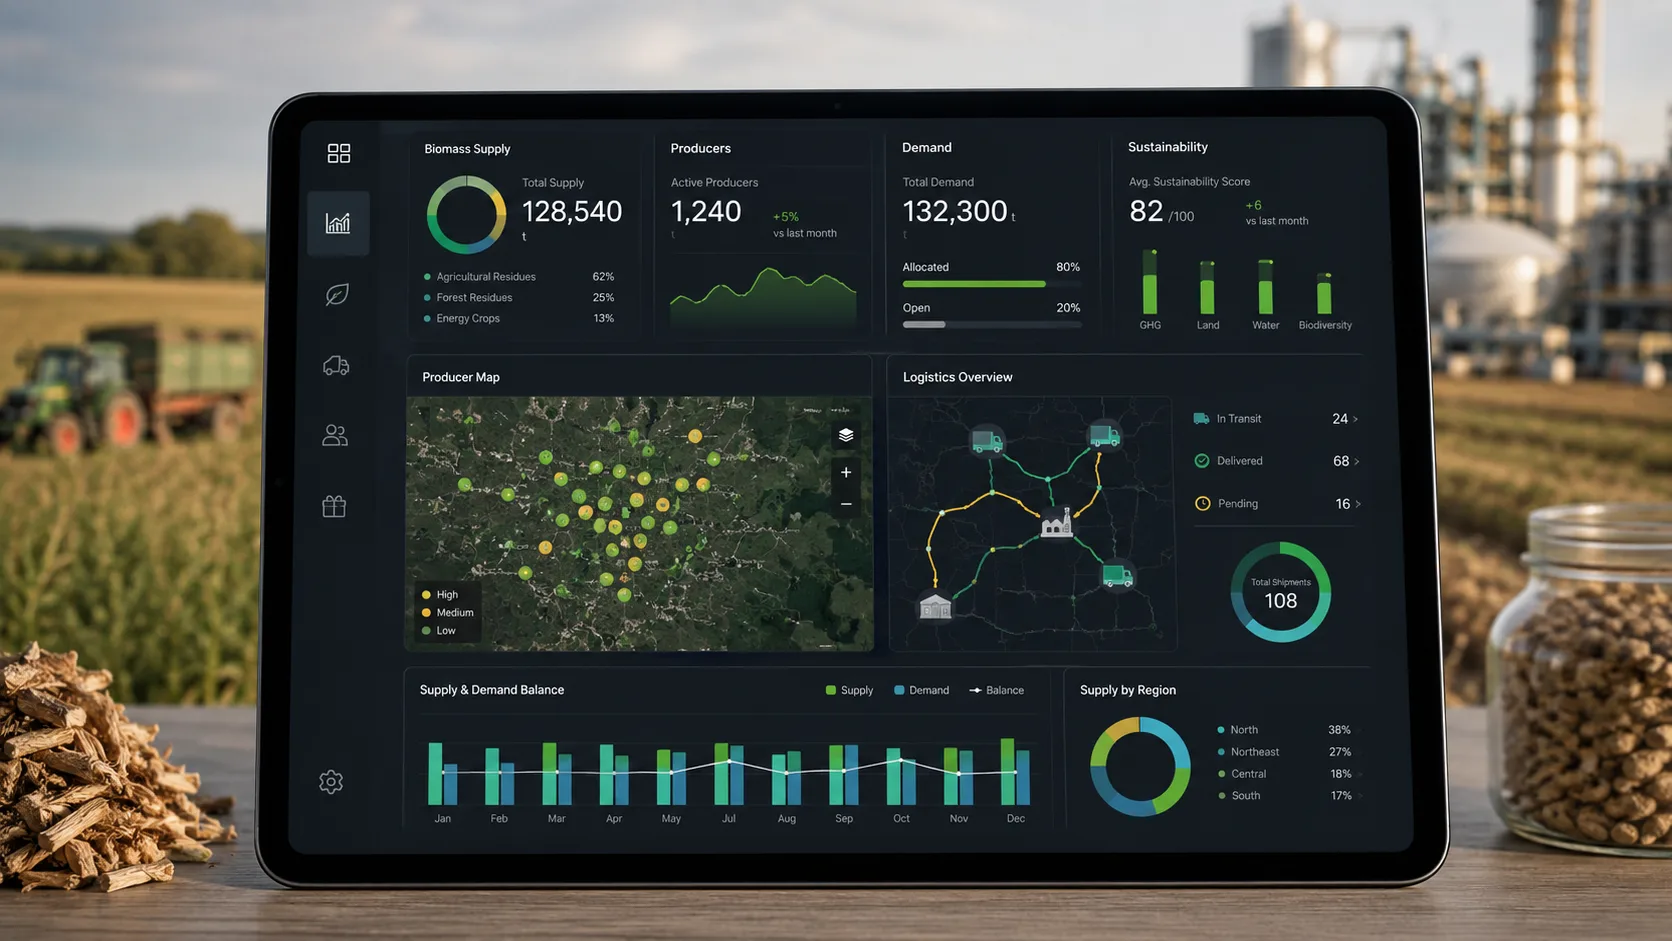
An illustrative view of the RETEDI decision-support approach: the resource, its logistics, the processing economics and the value flowing back to producers — in a single coordinated interface.
RETEDI · Regional Resource Console
Illustrative interface · demonstration data
Resource Map — registered producers
214
Registered producers
6
Resource categories
31,400
Mapped supply, t/yr
Supply Forecast — seasonality
Jun · Nov
Peak availability
87%
Quality within spec
Logistics
38 km
Mean collection radius
12
Routes optimised
14%
Transport cost share
Processing
18,000 t/yr
Hub capacity
0.82 t/t
Pellet yield
Economics
€4.2m
CAPEX, modelled
€61
OPEX, €/t
9,800 t
Break-even volume
Producer Value
€38/t
Payments to producers
+12%
Quality premium
163
Participating farms
Market Demand
Sustainability
6,900
CO₂e avoided, t/yr
92%
Residues recovered
1,150
Carbon to soil, t/yr
0.81
Circularity index
Platform modules
Eight modules, one operating picture.
01
Resource Map
Producer locations, resource categories and available biomass.
02
Supply Forecast
Seasonality, availability and quality.
03
Market Demand
Current and future product requirements.
04
Logistics
Collection routes, distance and transport intensity.
05
Processing
Capacity, utilisation, throughput and yield.
06
Economics
CAPEX, OPEX, product price, margin and break-even.
07
Producer Value
Payments, premiums and distribution.
08
Sustainability
Carbon, circularity, resource efficiency, soil and environmental metrics.
Why it works
Data is the difference between a pilot and a system.
Residue passports
Each stream carries its identity — origin, quantity, quality, season, treatment history — so downstream decisions rest on data, not assumption.
Supply–demand coordination
Producers see demand; processors see supply. The platform closes the information gap that keeps regional resources stranded.
Scenario modelling
Change the transport radius, hub capacity or product mix and watch the economics respond — before any capital is committed.
Traceability & trust
Transparent terms and auditable flows are what make producers participate and buyers commit.
Decision-support in the field, not just the boardroom
Ready to make your value chain visible?
From a first resource-mapping exercise to a full regional coordination platform — RETEDI structures the digital layer to match the maturity of the project.